


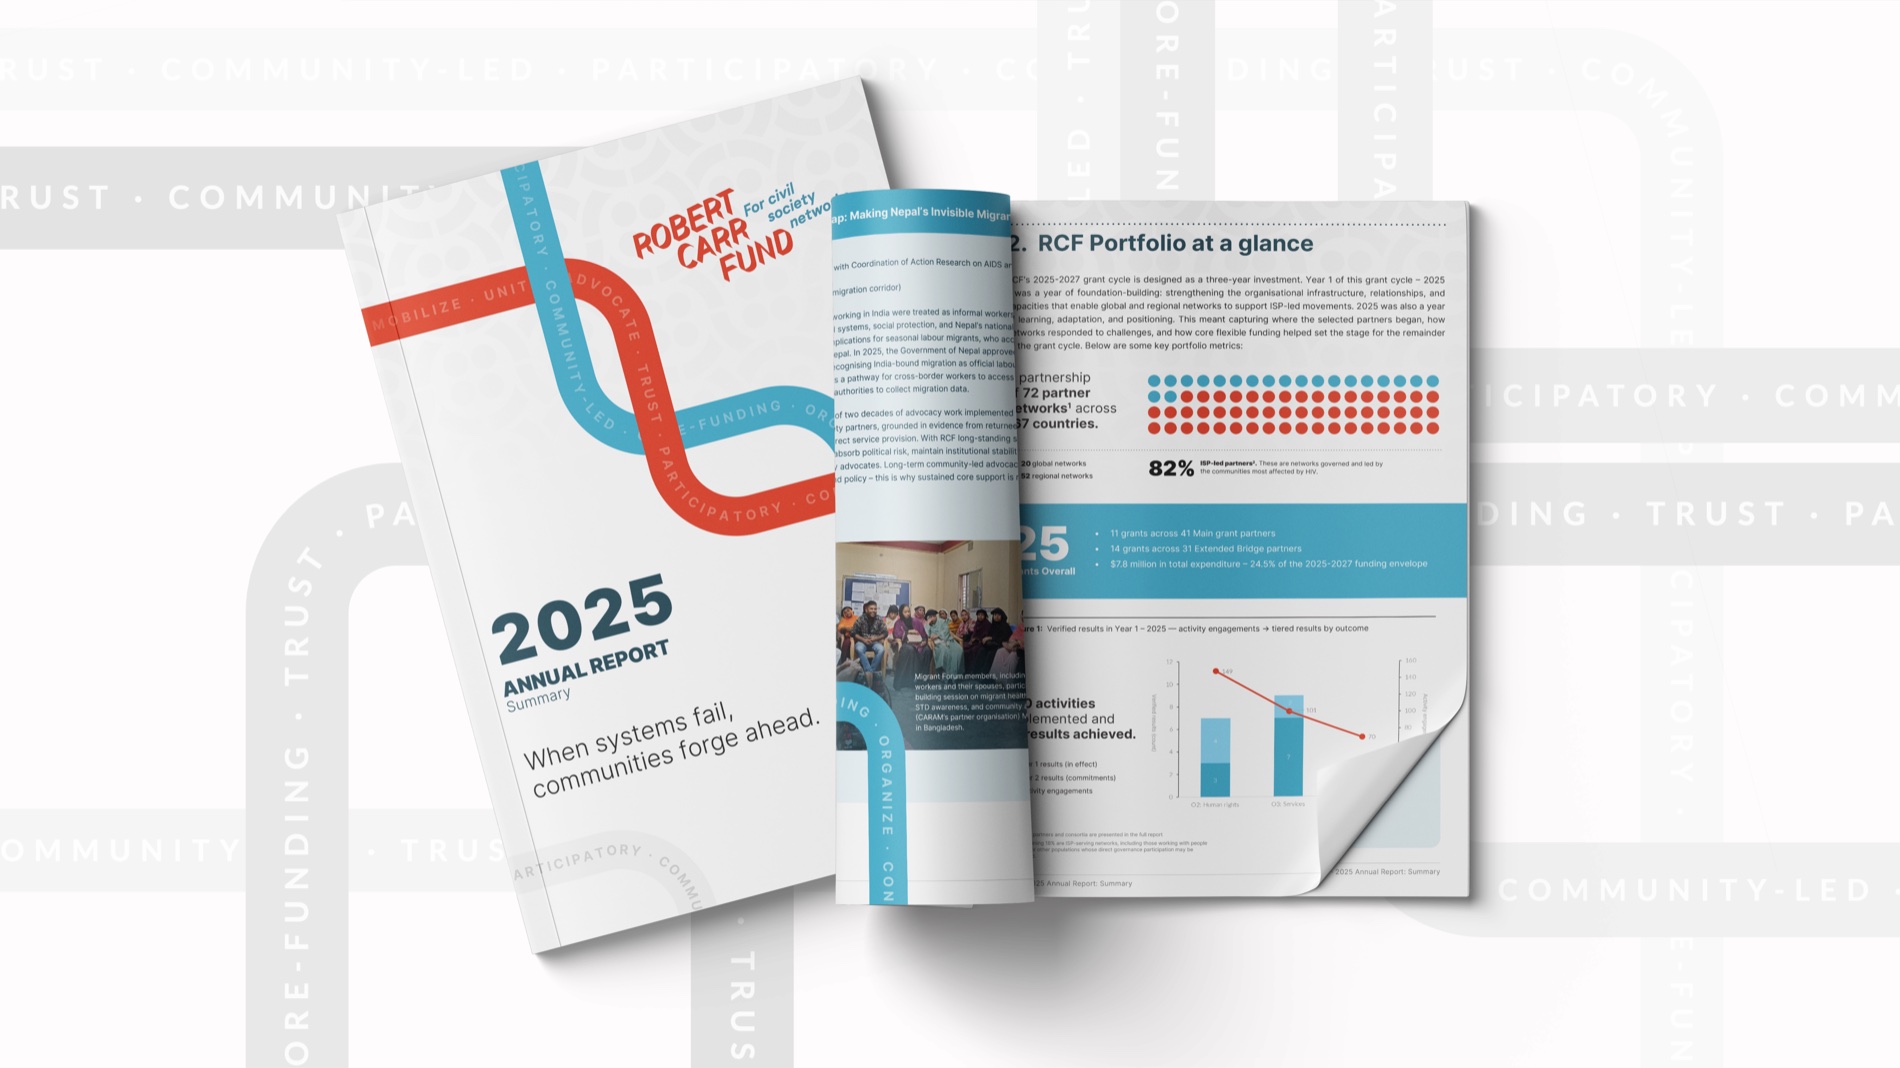
An annual report can be accurate, comprehensive and almost impossible to read. Every programme gets its pages. Every department gets its paragraph. The photographs arrive late, the charts arrive later, and the opening message tries to hold everything together.
The problem starts before layout. The document has been organised around the people producing it rather than the people reading it.
A useful report gives a reader a clear answer to three questions: What were you trying to change? What happened? Why should I care about what comes next?
Decide what the year adds up to
Before collecting contributions, write a short editorial argument for the report. One sentence is enough to begin: “This was the year we brought services closer to people who could not reach them.”
That sentence is a working hypothesis. Test it against the evidence. If the results tell a more complicated story, change it. A report should never force the facts to fit a neat theme.
Once the central argument is sound, it becomes a useful filter. Programme updates, interviews and figures can each help explain part of it. Material that does not belong in that story can sit in an appendix or a linked resource, where readers who need the detail can still find it.
Separate activity from change
“We held twelve workshops” describes an activity. It leaves the reader asking what those workshops made possible.
A stronger account explains who took part, what the sessions addressed and what evidence exists of a change afterwards. If you only have attendance data, say so. Do not turn participation into a claim about lasting impact.
Design can make this distinction visible. Put the main finding beside its explanation. Keep the reporting period and source close to the figure. Give limitations a readable place on the page, rather than shrinking them into a footnote nobody can use.
Give readers more than one way in
Someone reviewing a funding decision may read carefully. A partner may scan for the programme they know. A board member may go straight to the financial statements.
Build a reading structure that supports these different approaches. A clear contents page, informative section titles and well-written chart captions help readers find their route. A short summary can carry the argument for someone with five minutes, while the full chapters provide the detail behind it.
Pull quotes should earn their space. Choose a sentence that reveals a perspective or a consequence. Repeating a vague statement in large type does not make it more meaningful.
Design a spread before designing the whole report
Use a difficult section to test the design: a dense table, a long caption, an awkward photograph and a substantial passage of text. A cover and two beautiful opening pages will not show whether the system can handle the real document.
Check the test spread at its intended reading size. Can a reader follow the hierarchy? Are chart labels legible? Does a photograph add information? For a digital edition, include navigation and accessibility requirements in the production brief from the start.
The report is ready for full layout when the editorial structure and the design can carry the hardest material together.
Make the next report easier
Keep a record of the information that was hardest to find this time. Agree on image permissions, chart source files and programme reporting formats before the next reporting cycle begins.
A strong annual report is built through many small decisions made well before publication. The reward is a document that helps someone understand your work well enough to discuss it, question it and support it.